Documentation
Introduction
Seten is a tool for systematic identification and comparison of processes, phenotypes and diseases associated with RNA-binding proteins from condition-specific CLIP-seq profiles. It has a browser user interface and command line interface both of which implement the same method.
Features
Web interface
Seten's web interface (this website) provides an on-demand application for Seten's implementation.
- Runs almost all latest versions of modern browsers across all operating systems
- Requires no installation
- Utilizes HTML5 File API to read local files (fast and safe)
- Utilizes HTML5 Web Workers for parallel execution of tasks on multiple cores
- Visualizes multiple results as bar charts and bubble charts (for comparison)
- Provides options to visualize results with different thresholds
- Provides export buttons for bar charts, tables and bubble charts of the results
Command line interface
Seten also has a command line interface that implements the same method but also lets you analyze multiple datasets in a single command.
- Runs on all operating systems
- Requires single-line command installation (requires Python 2.7+, Python package manager)
- Utilizes standard Python multiprocessing module for parallel execution of tasks on multiple cores
- Inputs single BED file or multiple BED files in a directory
- Outputs results in TSV formatted tables
Please refer to its Github page for install and more detailed usage.
Implementation
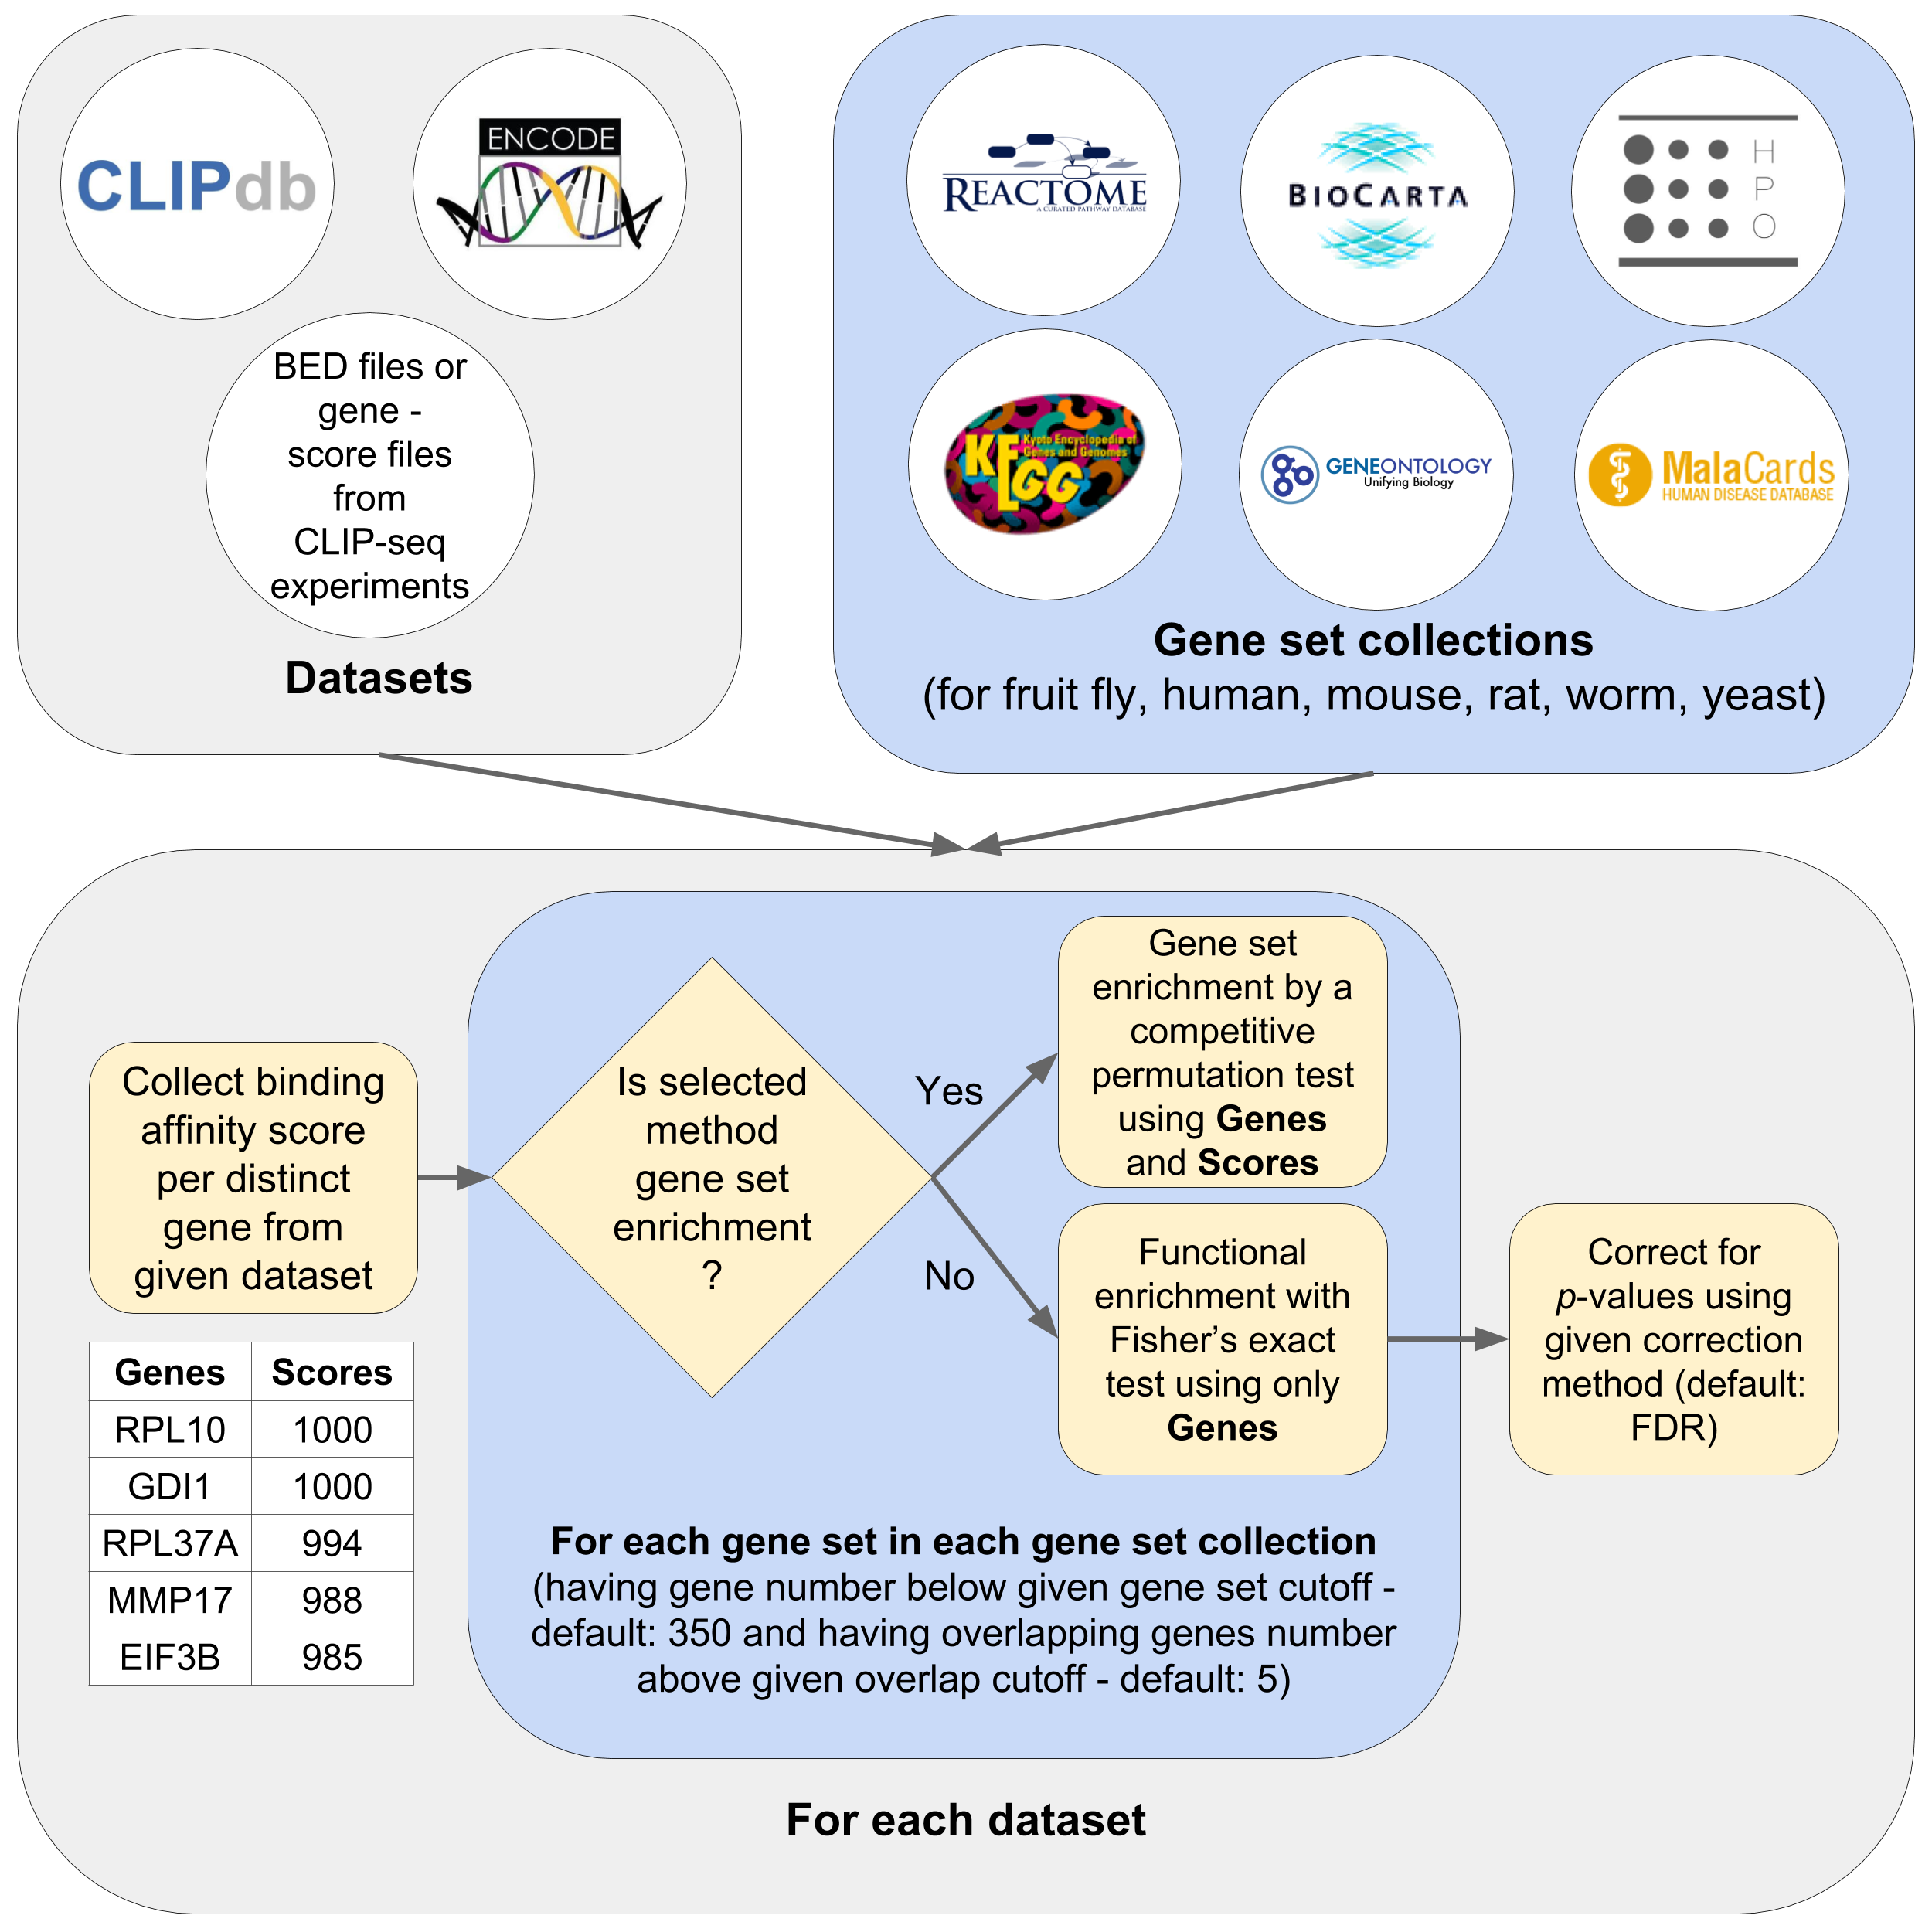
Binding sites from the input BED file are mapped onto their corresponding HGNC symbols using a mapping table from Ensembl. After mapping is complete, if multiple scores are available for a gene, highest of the scores is taken to represent that gene, which results in distinct set of genes and their corresponding scores representing the extent of binding by an RBP. Next, for every gene set in a gene set collection; (i) functional enrichment is performed by using Fisher’s Exact test, (ii) gene set enrichment is performed by implementing a permutation based test where for each gene set, the common genes between the gene set and the dataset are found, multiple times (e.g. 1000), the scores of common genes are compared with the scores of randomly picked genes using Mann Whitney U test, and a final p-value is computed by max(1 – # sign. tests / # total tests, 1 / # total tests), and (iii) after correcting p-values from functional enrichment part, p-values for every gene set from functional enrichment and gene set enrichment are combined to have a single p-value for each gene set by using Fisher’s method of p-value integration. Fisher’s exact test is one of the common ways of measuring functional enrichment of a gene set in a dataset, which takes the number of common genes (but not the extent of binding in the context of CLIP-seq profiles) between a gene set and the input dataset. However, since each gene in the input resulting from CLIP-seq experiments can have a different score, by permuting multiple times and checking if the scores of common genes are significantly higher than randomly picked scores (p < 0.05; 1000 iterations), we’re also taking the scores into account which can’t be handled by standard functional enrichment tests. We have validated that p-values obtained from functional enrichment and gene set enrichment are independent and hence employed Fisher’s method for combining these p-values.
Datasets
The following datasets are used to test Seten during development and also their gene set association results are given in Seten's browser user interface (this website) under Explore panel. We downloaded human RBP datasets including target binding affinity scores from CLIPdb 1 and ENCODE project 2. Since there are multiple samples for some RBP-cell line pairs in CLIPdb and ENCODE, we simply merged them before the gene set association analyses. After preprocessing these datasets, we obtained 68 unique RBP-cell line pairs for CLIPdb and 138 unique RBP-cell line pairs for the ENCODE project.
Inputs
File
The input file for Seten can be a UCSC BED formatted text file or Tab-separated (two-column) gene - score file. The BED file is the most common format used by peak callers. However, if you have a two-column gene - score file, you can also use it but please make sure you use the official gene name for the corresponding organism (e.g. FlyBase Gene Name for fruit fly datasets) and don't include the header line.
A BED file is a UCSC BED formatted text file which stores chromosomal location data as lines. Seten requires (at least) 5-column BED file having chrom, chromStart, chromEnd, name, score. Go to UCSC's website to obtain more information about BED format.
The first 10 lines of a sample BED file is as follows:
chr1	566740	566760	binding_site_1	25	.	2.83477e-06
chr1	566860	566880	binding_site_2	10	.	0.00657314
chr1	569040	569060	binding_site_3	11	.	0.00469793
chr1	881160	881180	binding_site_4	9	.	0.00843972
chr1	1035940	1035960	binding_site_5	8	.	0.00997733
chr1	1152440	1152460	binding_site_6	8	.	0.00997733
chr1	1242120	1242140	binding_site_7	9	.	0.00843972
chr1	1328880	1328900	binding_site_8	10	.	0.00657314
chr1	1337360	1337380	binding_site_9	8	.	0.00997733
chr1	1438640	1438660	binding_site_10	12	.	0.00315889
...
Organism
There are six available organisms provided in Seten's web interface:
- Human (hg19 build and hg38 build)
- Mouse (mm10 build)
- Rat (rn6 build)
- Fruit fly (dme6 build)
- Worm (cel235 build)
- Yeast (r64-1-1 build)
It's possible to extend the Seten for more organisms; however, this is only available for Seten's command line interface. Please refer to its Github page for more information.
Gene set collections
Following gene set collections are available in Seten's both web interface and command line interface. In parenthesis, the availability of that gene set collection for the corresponding organisms is given.
- Pathways: BIOCARTA (human, mouse)
- Pathways: REACTOME (human, mouse, rat, fruit fly, worm, yeast)
- Pathways: KEGG (human, mouse, rat, fruit fly, worm, yeast)
- GO: Biological Process (human, mouse, rat, fruit fly, worm, yeast)
- GO: Molecular Function (human, mouse, rat, fruit fly, worm, yeast)
- GO: Cellular Compartment (human, mouse, rat, fruit fly, worm, yeast)
- Human Phenotype Ontology (human)
- MalaCards Disease Ontology (human)
Enrichment method
By default, Seten uses a gene set enrichment method based on permutation. It also provides a traditional functional enrichment analysis method (implementing Fisher's exact test or FET).
Scoring method
The scoring method is used to compute single gene level score from multiple scores for the same gene (after mapping to genes from chromosomal locations or given multiple scores in the two column gene - score file) in CLIP-seq datasets. By default, maximum method is selected, which gets the maximum score among all scores for the same gene and does the gene set enrichment based on that score. Other methods are minimum, mean, median, sum.
Note that it's only available for gene set enrichment analysis.
Correction method
The correction method is used to correct p-values obtained from functional enrichment analysis (Fisher's exact test or FET). Currently, Seten's web interface has only one method, which is false discovery rate (FDR) or Benjamini - Hochberg. Seten's command line interface includes several more methods or correcting these p-values.
Note that it's only available for functional enrichment analysis.
Gene set cutoff
The gene set cutoff (defaulting to 350) is used to set an upper limit to gene set enrichment analysis or functional analysis for doing the analysis on the gene sets that are more specific.
Overlap cutoff
The overlap cutoff (defaulting to 5) is used to set a lower limit to number of overlapping genes between each gene set and the CLIP-seq dataset to eliminate the gene sets that have a few genes in common with the given datasets.
For getting statistically meaningful results, it's better to set it as at least 5.
Significance cutoff
The significance cutoff (defaulting to 0.05) is used to set an upper limit to the p-value obtained from Mann-Whitney U test done in each permutation of gene set enrichment analysis to check if the scores (of genes common between each gene set and the given dataset) are significantly higher than randomly picked scores the same dataset.
Note that it's only available for gene set enrichment analysis.
Number of iterations
The number of iterations (defaulting to 1000) is the number of times to permutate and check for significance using randomly picked scores.
Note that it's only available for gene set enrichment analysis.
Outputs
Bar charts
Bar charts are available only in web interface. They represent significant results based on percent (defaults to > 5%) and p-value (defaults to < 0.01) thresholds. These thresholds can be configured in the options. X-axis of bar charts has the names of gene sets and y-axis has the significance values obtained by –Log10(Combined p-value of the gene set).
Tables
Tables are available in both interfaces of Seten. They are provided for each gene set collection, and they represent gene set association results. In browser user interface, tables can show significant results based on percent (defaults to > 5%) and p-value (defaults to < 0.01) thresholds. Its columns are;
- Gene set name
- Overlapping genes
- Number of overlapping genes
- Number of genes in the gene set
- Percent of overlapping genes in the genes of the gene set
- p-value for functional enrichment
- Corrected p-value for functional enrichment
- p-value for gene set enrichment
- Combined p-value from functional (after correction) and gene set enrichment
Bubble charts
Bubble charts are available only in web interface. They represent significant results based on percent (defaults to > 5%) and p-value (defaults to < 0.01) thresholds. These thresholds can be configured in the options. X-axis of bubble charts has the names of RBPs and y-axis has the gene set names. The radius of bubbles comes from their corresponding significance values obtained by –Log10(Combined p-value of the gene set).
Tutorial
Please go to tutorial page that can guide you to use Seten.
Support
Please go to contact page to report any issues or reach to us.
Source code
Source code of the two interfaces available on GitHub.
References
- Yang, Y. C. T., Di, C., Hu, B., Zhou, M., Liu, Y., Song, N., ... & Lu, Z. J. (2015). CLIPdb: a CLIP-seq database for protein-RNA interactions. BMC genomics, 16(1), 51.
- Lovci, M. T., Ghanem, D., Marr, H., Arnold, J., Gee, S., Parra, M., ... & Massirer, K. B. (2013). Rbfox proteins regulate alternative mRNA splicing through evolutionarily conserved RNA bridges. Nature structural & molecular biology, 20(12), 1434-1442.
- Subramanian, A., Tamayo, P., Mootha, V. K., Mukherjee, S., Ebert, B. L., Gillette, M. A., ... & Mesirov, J. P. (2005). Gene set enrichment analysis: a knowledge-based approach for interpreting genome-wide expression profiles. Proceedings of the National Academy of Sciences of the United States of America, 102(43), 15545-15550.
- Köhler, S., Doelken, S. C., Mungall, C. J., Bauer, S., Firth, H. V., Bailleul-Forestier, I., ... & FitzPatrick, D. R. (2013). The Human Phenotype Ontology project: linking molecular biology and disease through phenotype data. Nucleic acids research, gkt1026.
- Rappaport, N., Twik, M., Nativ, N., Stelzer, G., Bahir, I., Stein, T. I., ... & Lancet, D. (2014). MalaCards: A Comprehensive Automatically‐Mined Database of Human Diseases. Current Protocols in Bioinformatics, 1-24.