Tutorial
This tutorial provides insights on how to use Lantern.
Search lncRNA ontology and genomic annotations:
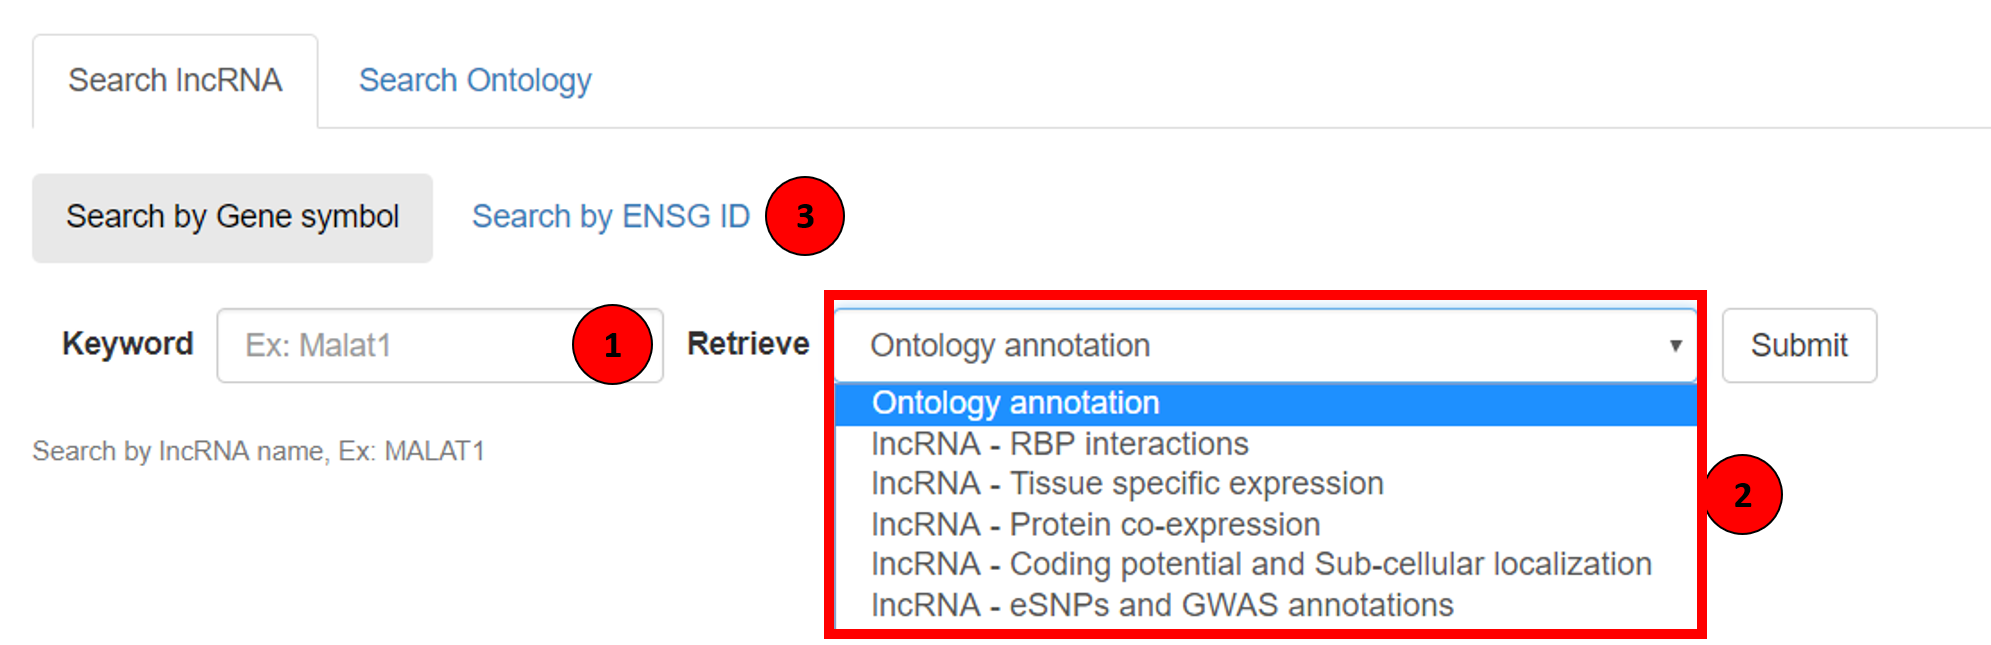
The tag 1 in the screenshot showing the search box. In this search box user can type the lncRNA name of interest and the auto-suggestive system prompts the complete lncRNA name. In the highlighted box 2, various annotations available on Lantern can be seen. Lantern can also be queried using ENSG IDs, users can enable this by clicking on the Search by ENSG tab (tagged as 3 in the screenshot).
A. Ontology annotations for lncRNA as a network:
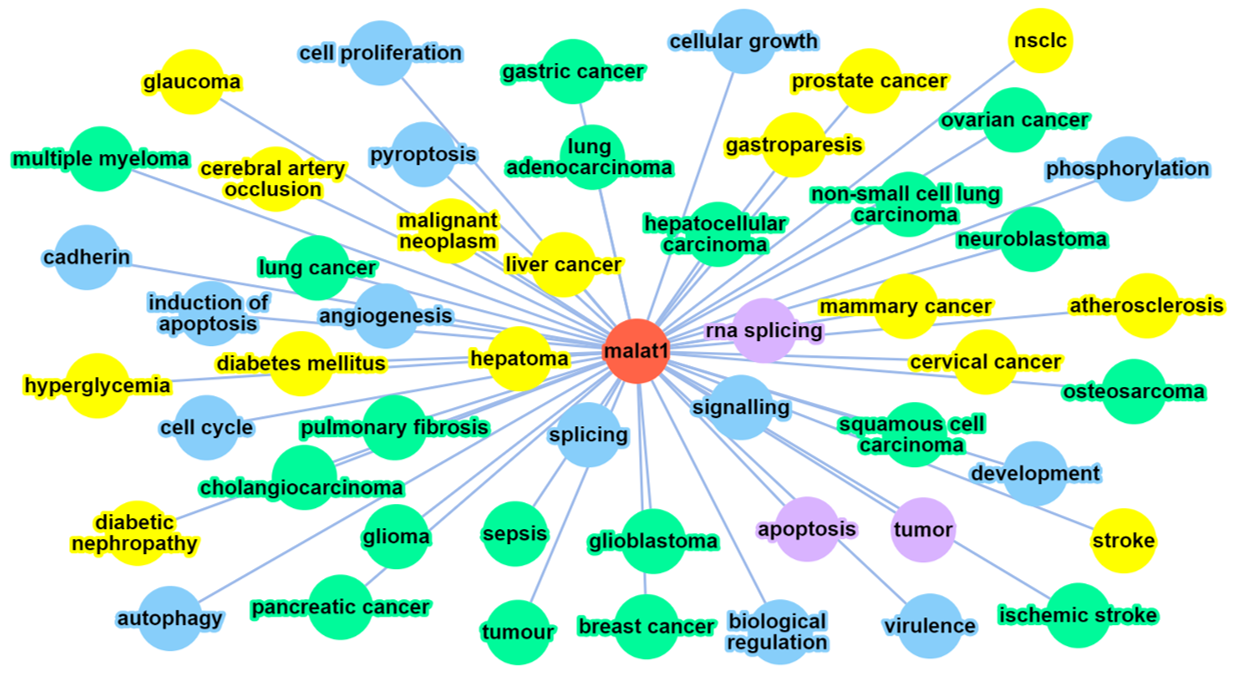
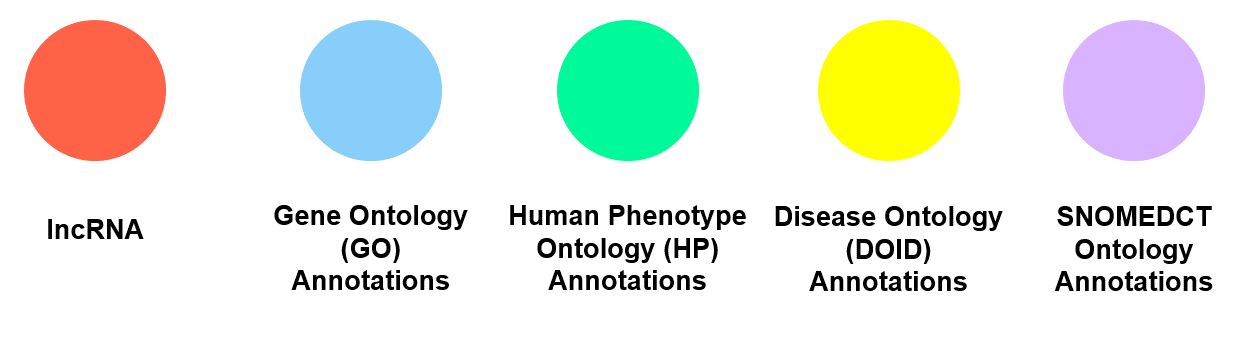
The result of a user’s query for ontology annotation for a given lncRNA will be similar to the above screenshot, followed by the legend describing the annotations’ properties. The nodes and edges in this network are dynamic.
Ontology annotation result table:
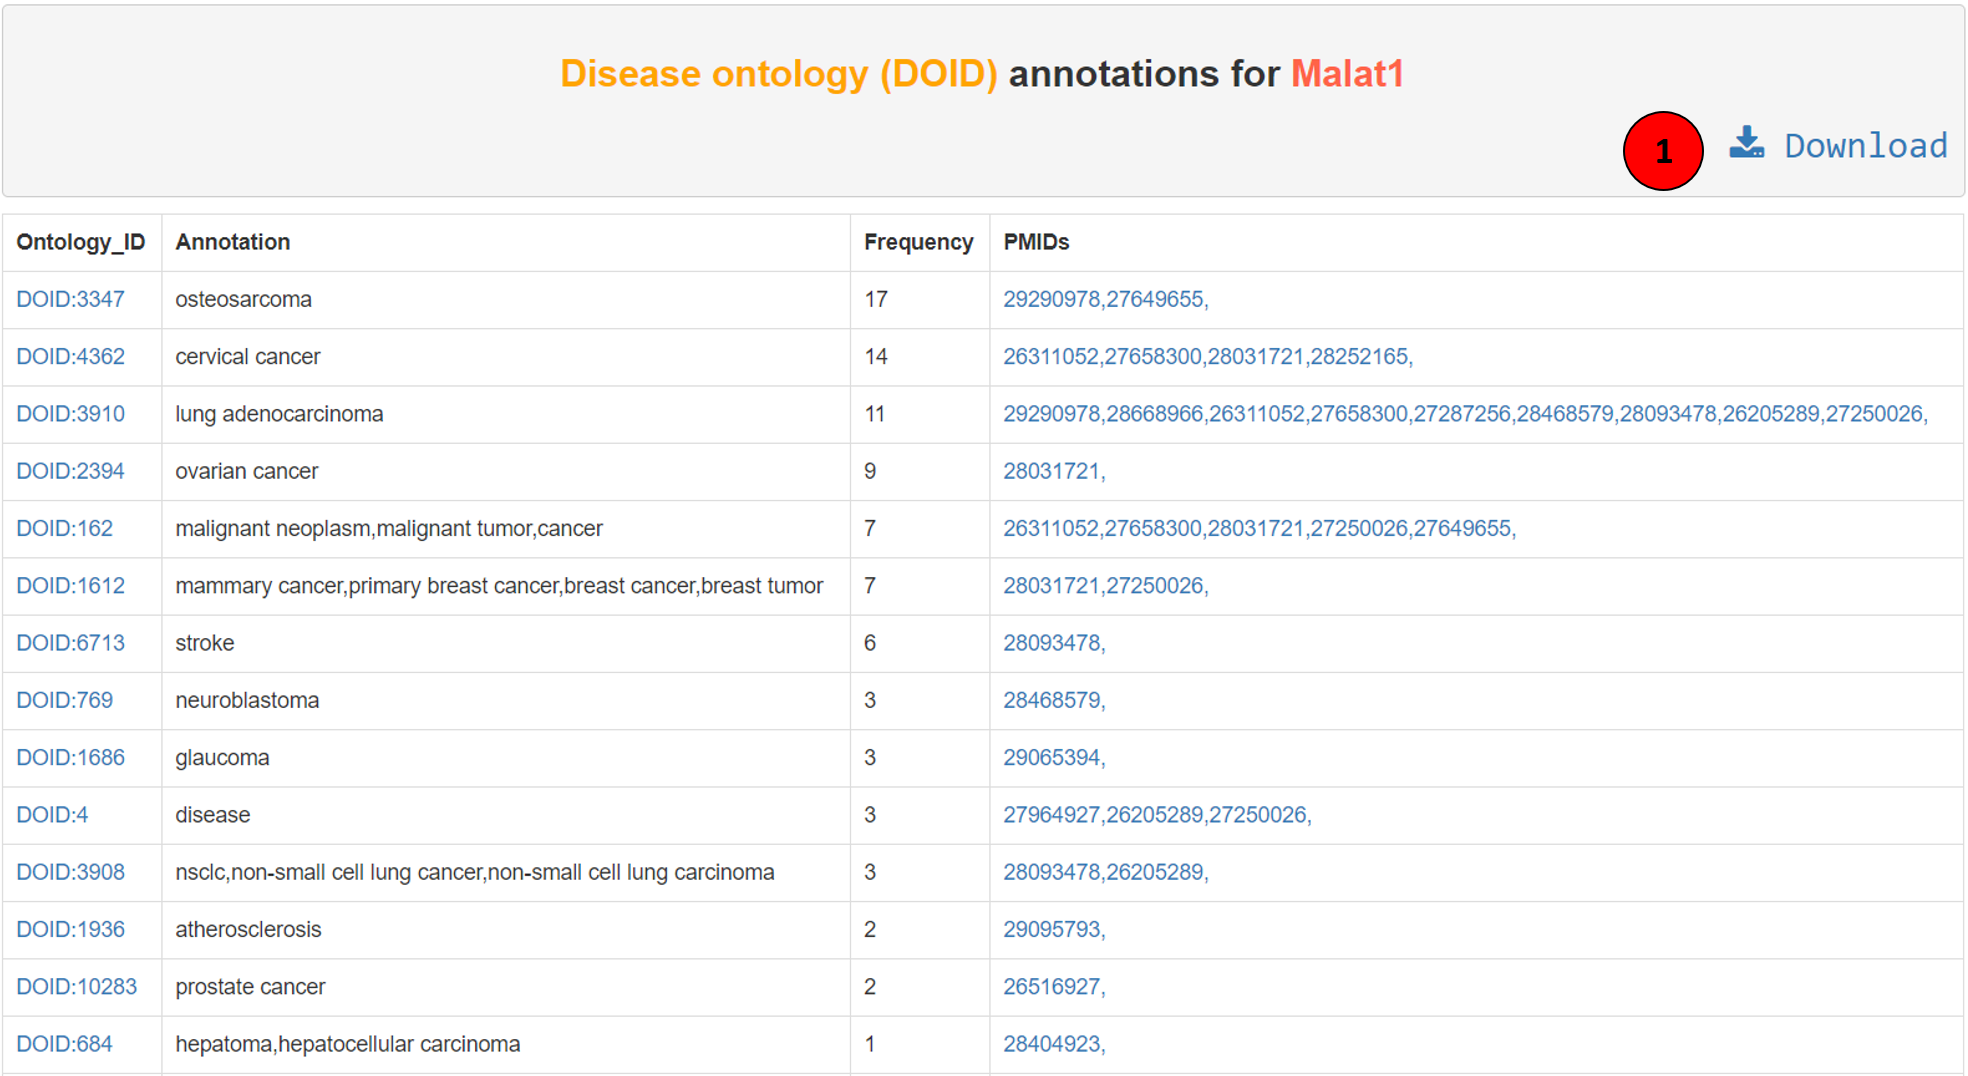
The ontology annotations on Lantern can also be seen as tables for each ontology after each search. The above screenshot shows disease ontology annotations for lncRNA Malat1. The first column is the ontology ID, hyperlinked to the respective website. Second column is the ontology definition, and the third column is the frequency of the ontology in the source. The fourth column is the PMID of the article from which this annotation was extracted, hyperlinked to the PubMed. The whole table can be downloaded using the download button (tagged as 1 in the screenshot).
B. RBP-lncRNA interactions:
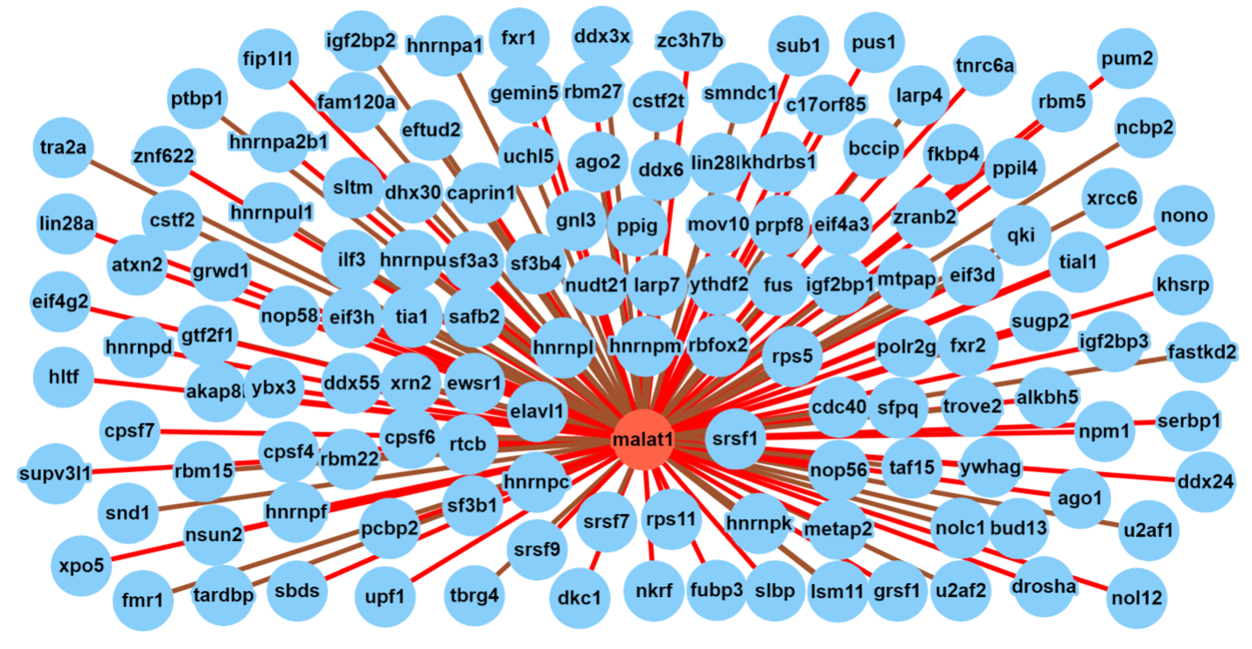
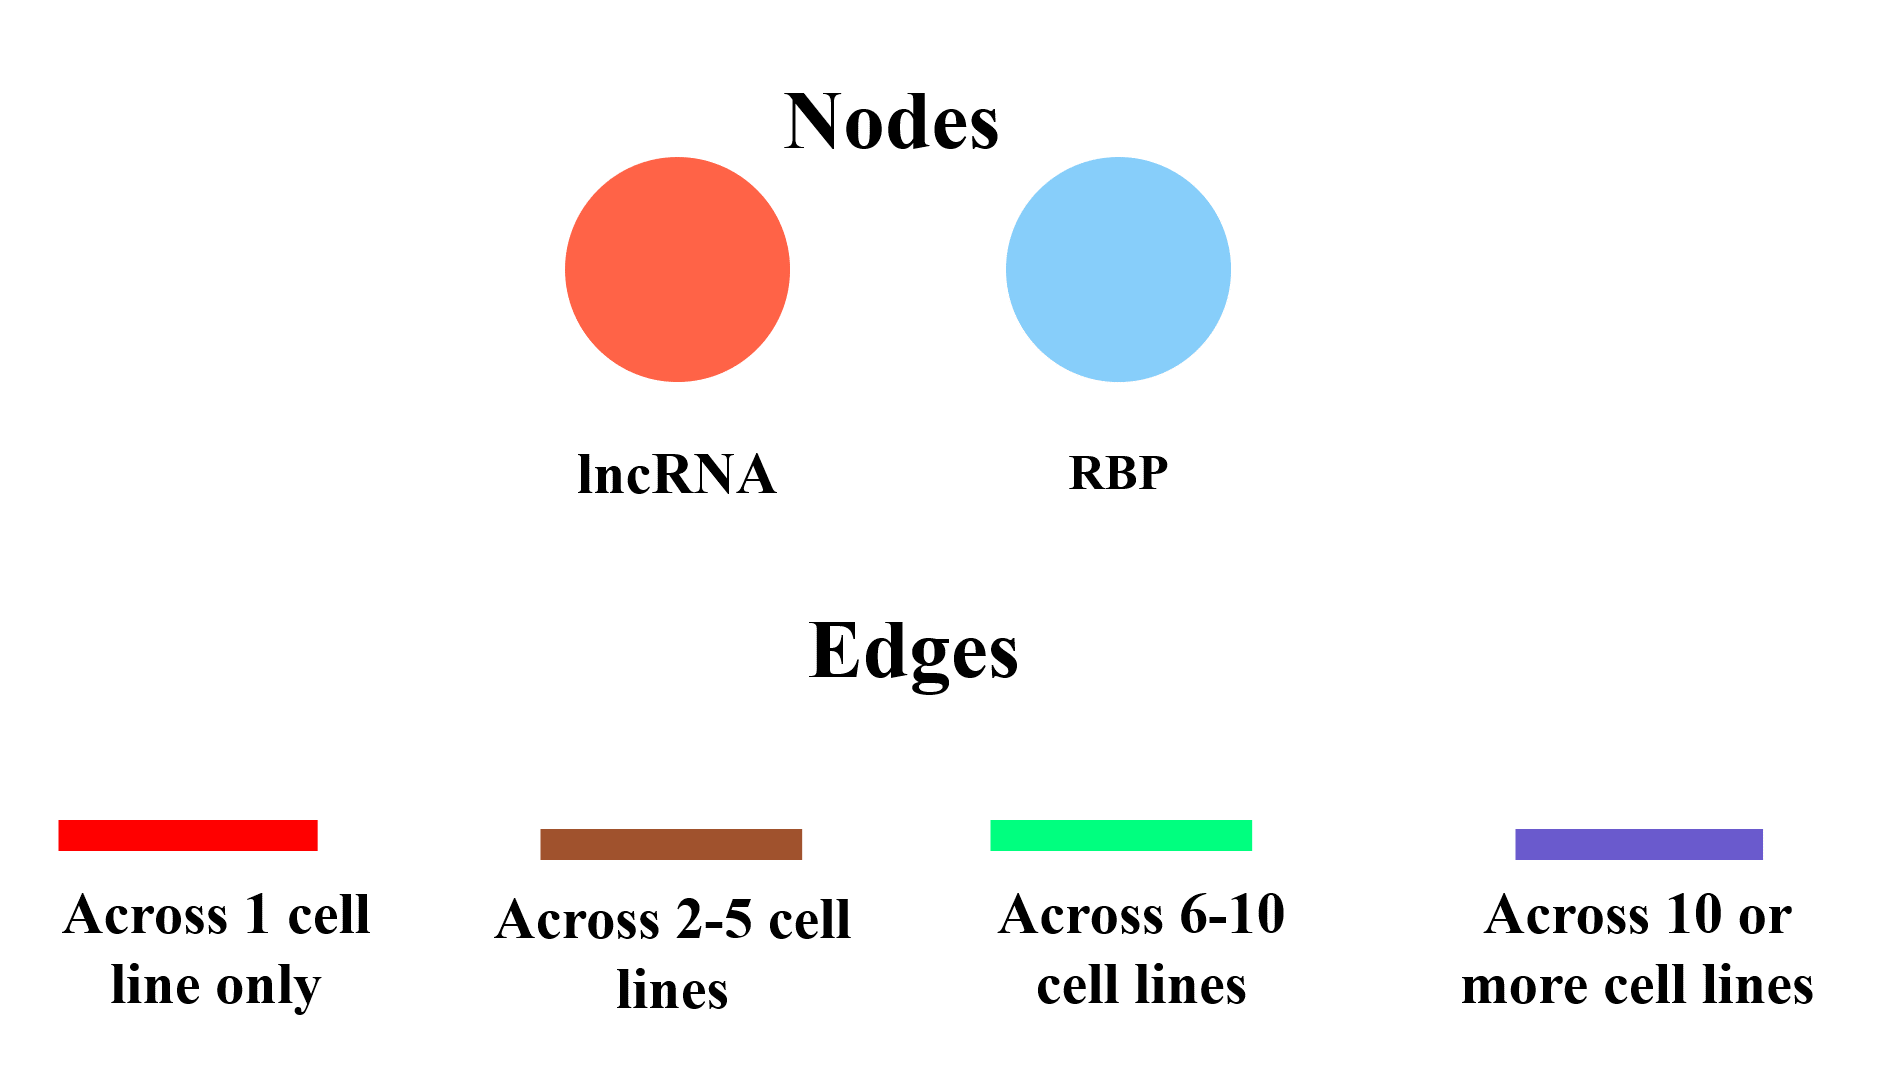
The search result for RBP interactions of lncRNA can be visualized as a dynamic network as seen in the above screenshot. The legends describe the node and edge characteristics.
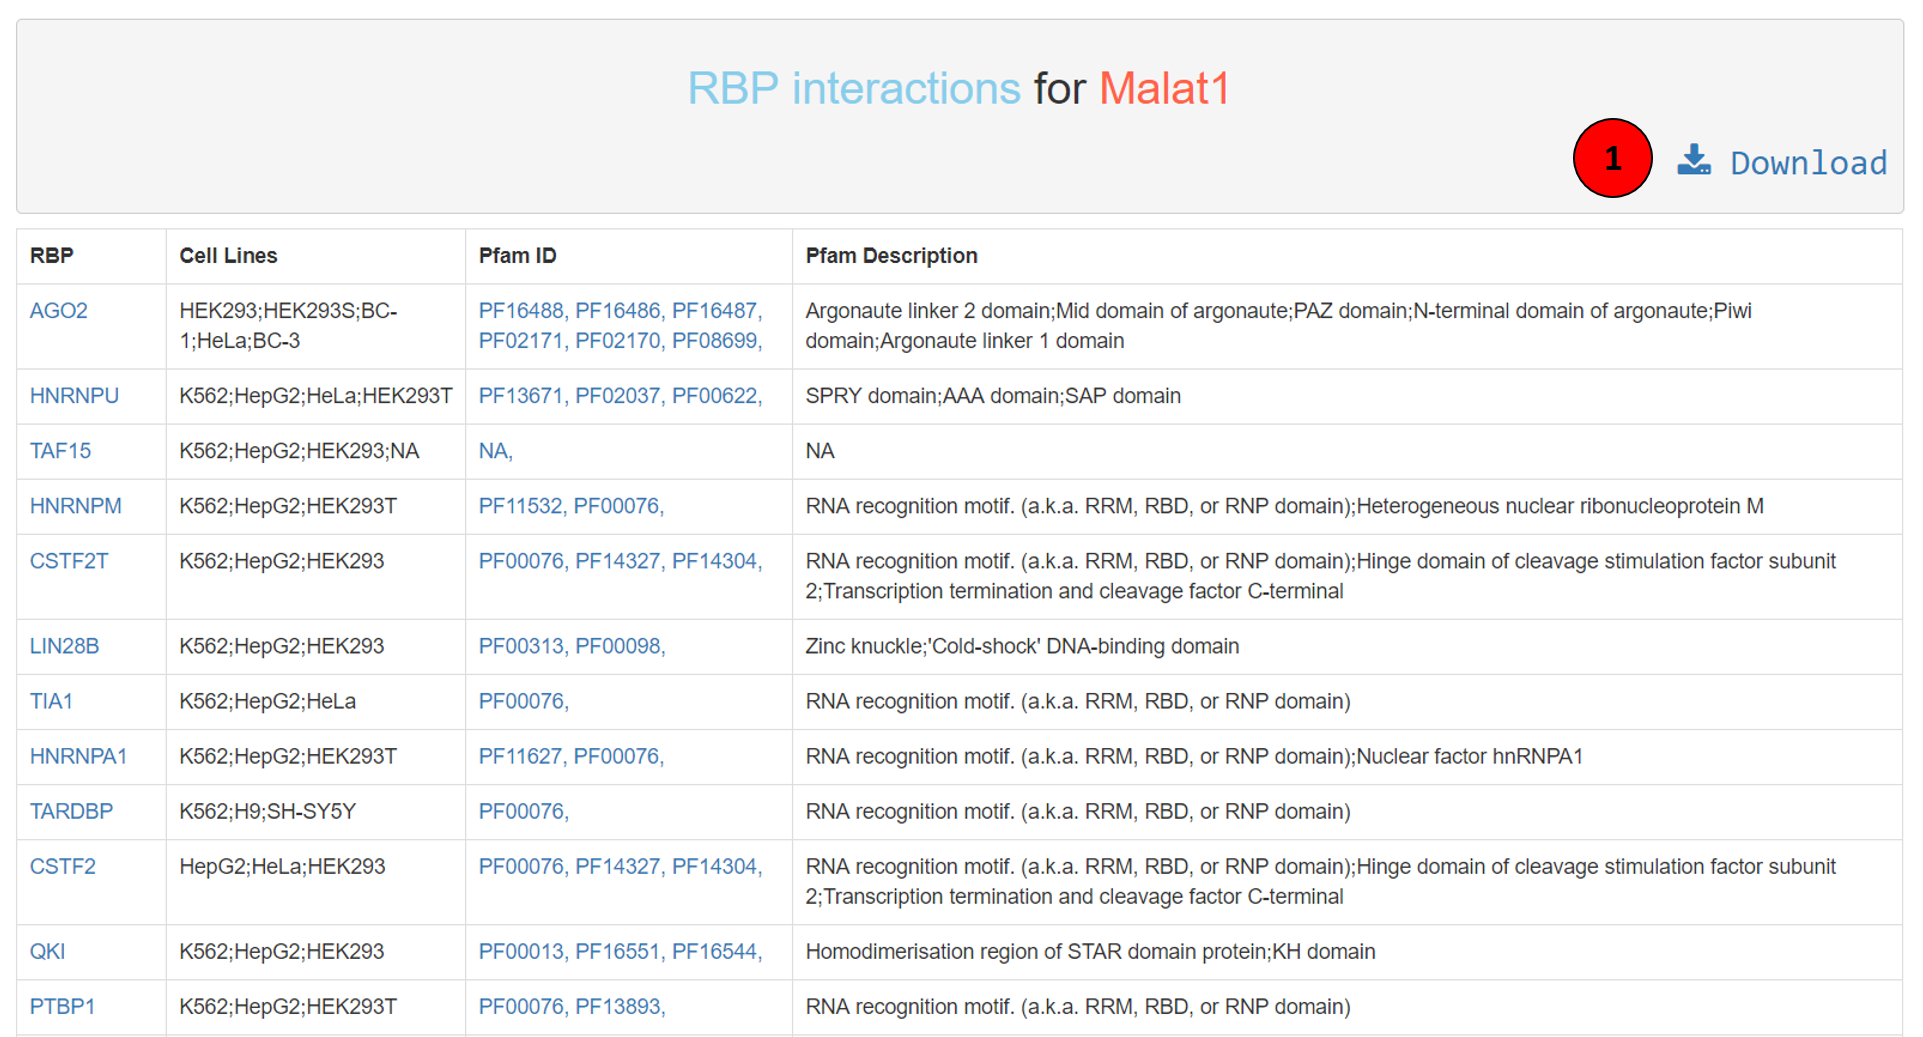
The lncRNA-RBP interaction result table has the following structure: first column the RBP name that was identified to be interacting with the lncRNA of interest. Second column is the list of all the cell lines this interaction was recorded in. Third and fourth columns describes the protein family ID and definition of the RBP. The RBP name is hyperlinked to ‘RNA Binding Protein Expression and Disease Dynamics database (READDB)’, a resource developed by our group, which annotates RBPs with data from multiple experimental studies, tissue expression, microRNA predictions, disease associations, protein-protein interactions and their sequence motifs. The Pfam IDs are hyperlinked to EMBL’s protein family information website. The whole table can be downloaded using the download button (tagged as 1 in the screenshot).
C. Tissue specific expression of lncRNA:
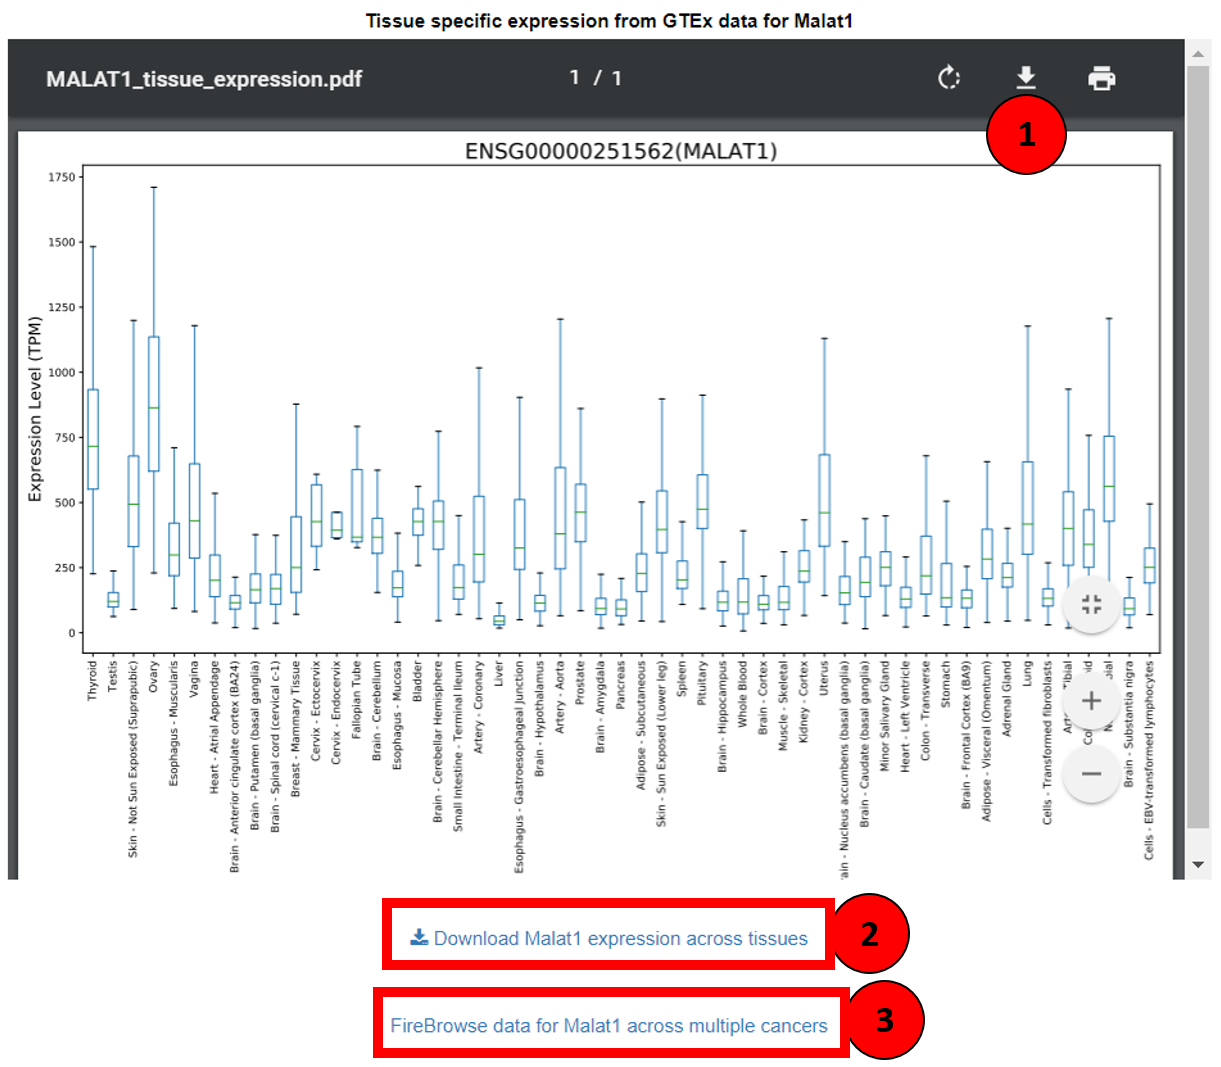
This component of Lantern helps users contemplate the expression of a lncRNA across 53 normal human tissues. This data is available in the form of boxplots showing the abundance of lncRNA in TPM (Transcripts Per Kilobase Million) across tissue, as seen in the screenshot. Not only the boxplot can be imported as PDF (tagged as 1 in the screenshot) but also the expression data itself can be downloaded as a tab separated file by clicking on ‘Download expression across tissues’ (box 2). To visualize the same lncRNA’s expression in multiple cancers, users can click on the ‘FireBrowse data for lncRNA across multiple cancers’ (box 3) which redirects to Fire Browse’s gene view.
D. LncRNA protein co-expression:
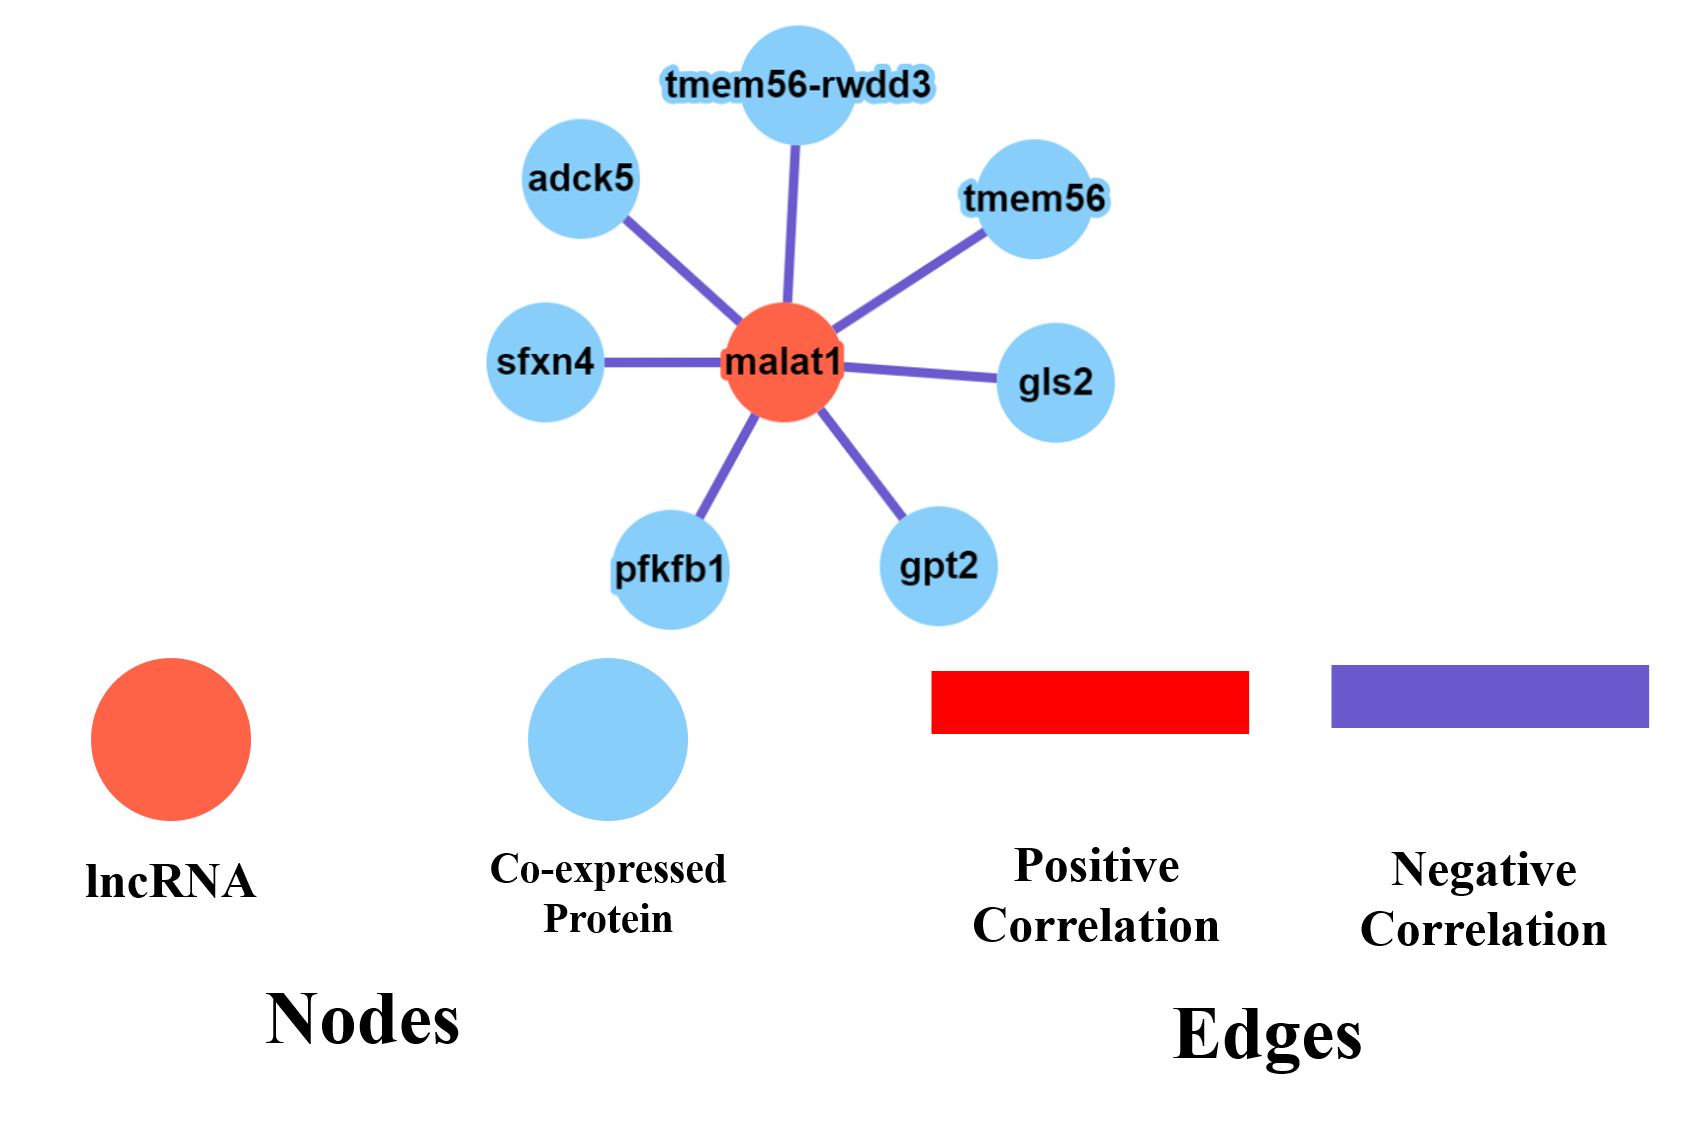
The search result for lncRNA protein co-expression can be visualized as a dynamic network as seen in the above screenshot. The legends describe the node and edge characteristics.
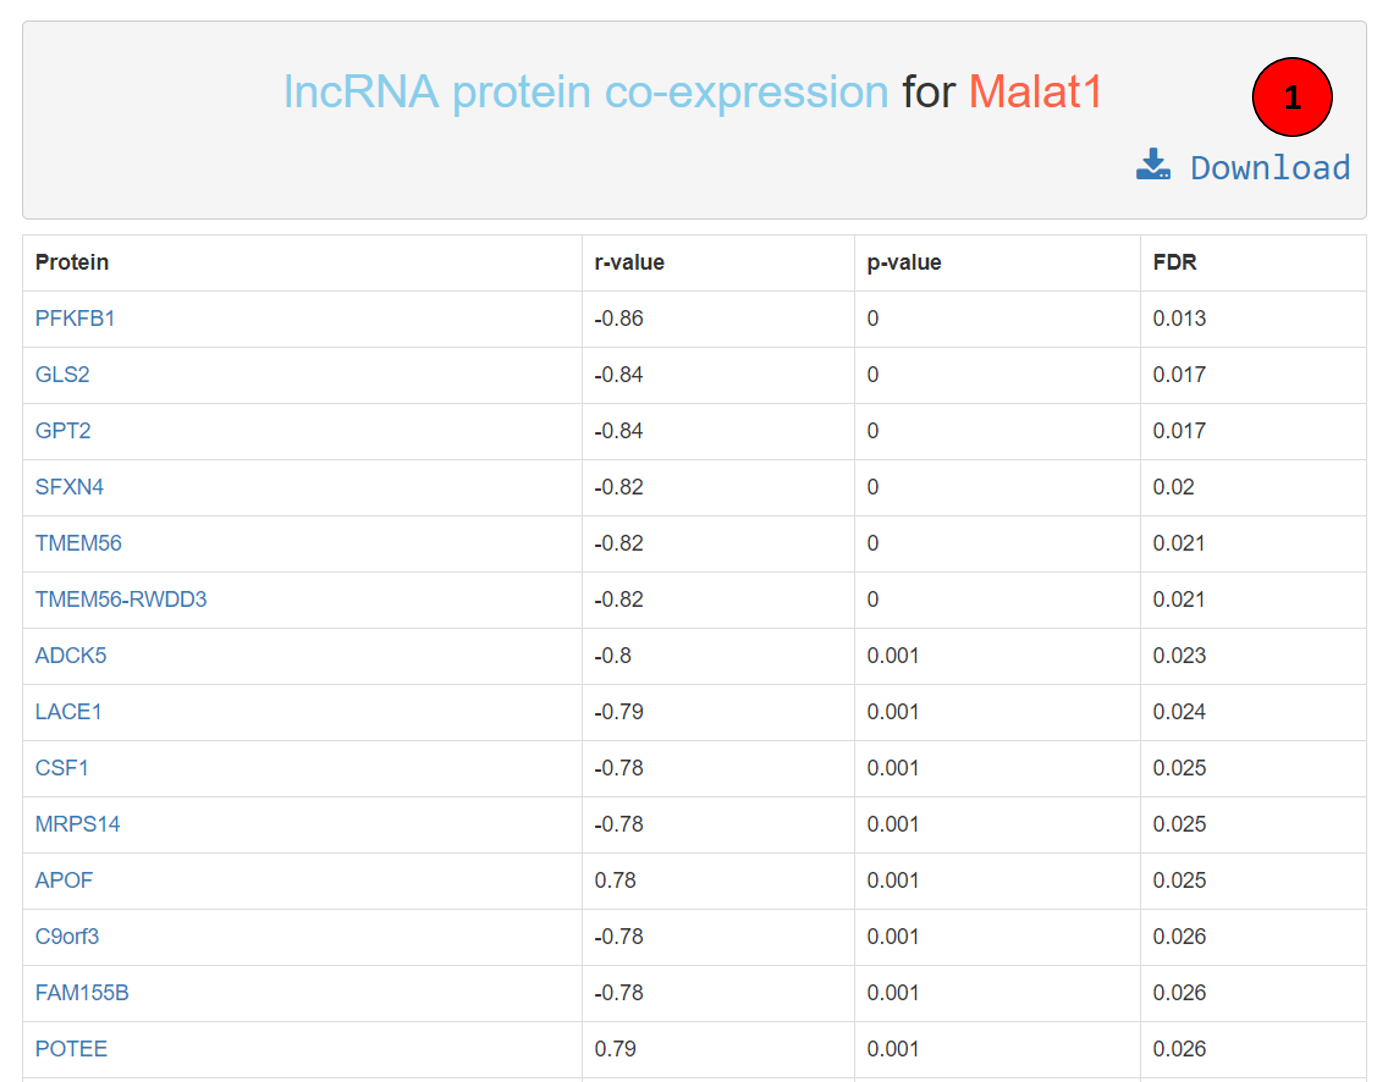
The lncRNA-protein co-expression result table has the following structure: first column has the co-expressed protein name, hyperlinked to GeneCards for further information about the protein. Second column is the Spearman Rank Correlation or Spearman’s rho. Followed by p-value of the correlation in the third column and respective FDR in the fourth column. The whole table can be downloaded using the download button (tagged as 1 in the screenshot).
E. Sub-cellular localization of lncRNA:
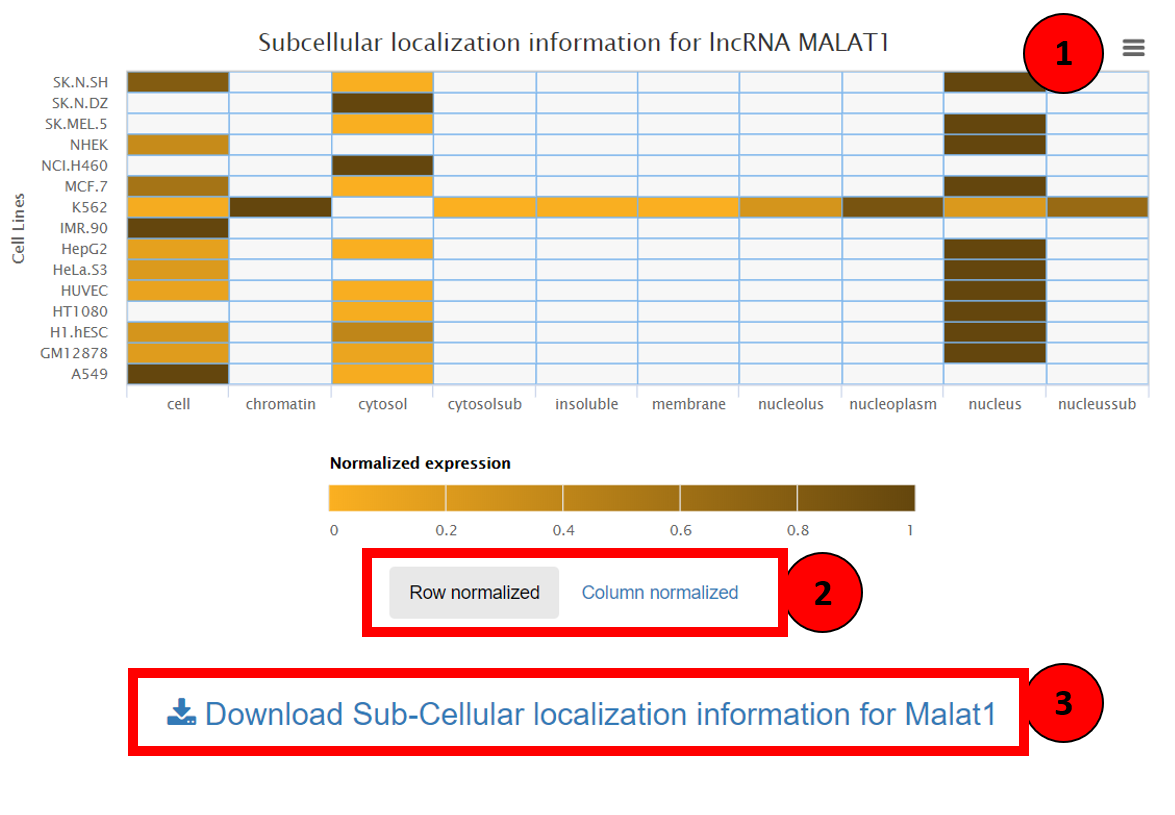
Sub-cellular localization of lncRNA can be visualized by a dynamic heatmap showing the compartmental abundance of lncRNA across multiple cell lines. This heatmap can be imported in multiple formats using the import button on the top right corner (marked as 1 in the screenshot). This heatmap can also be row, column normalized based on user’s preference, it can be altered by toggling between the two options shown in box 2. The raw data of the localization can be downloaded using the link highlighted box 3.
F. LncRNA coding potential:
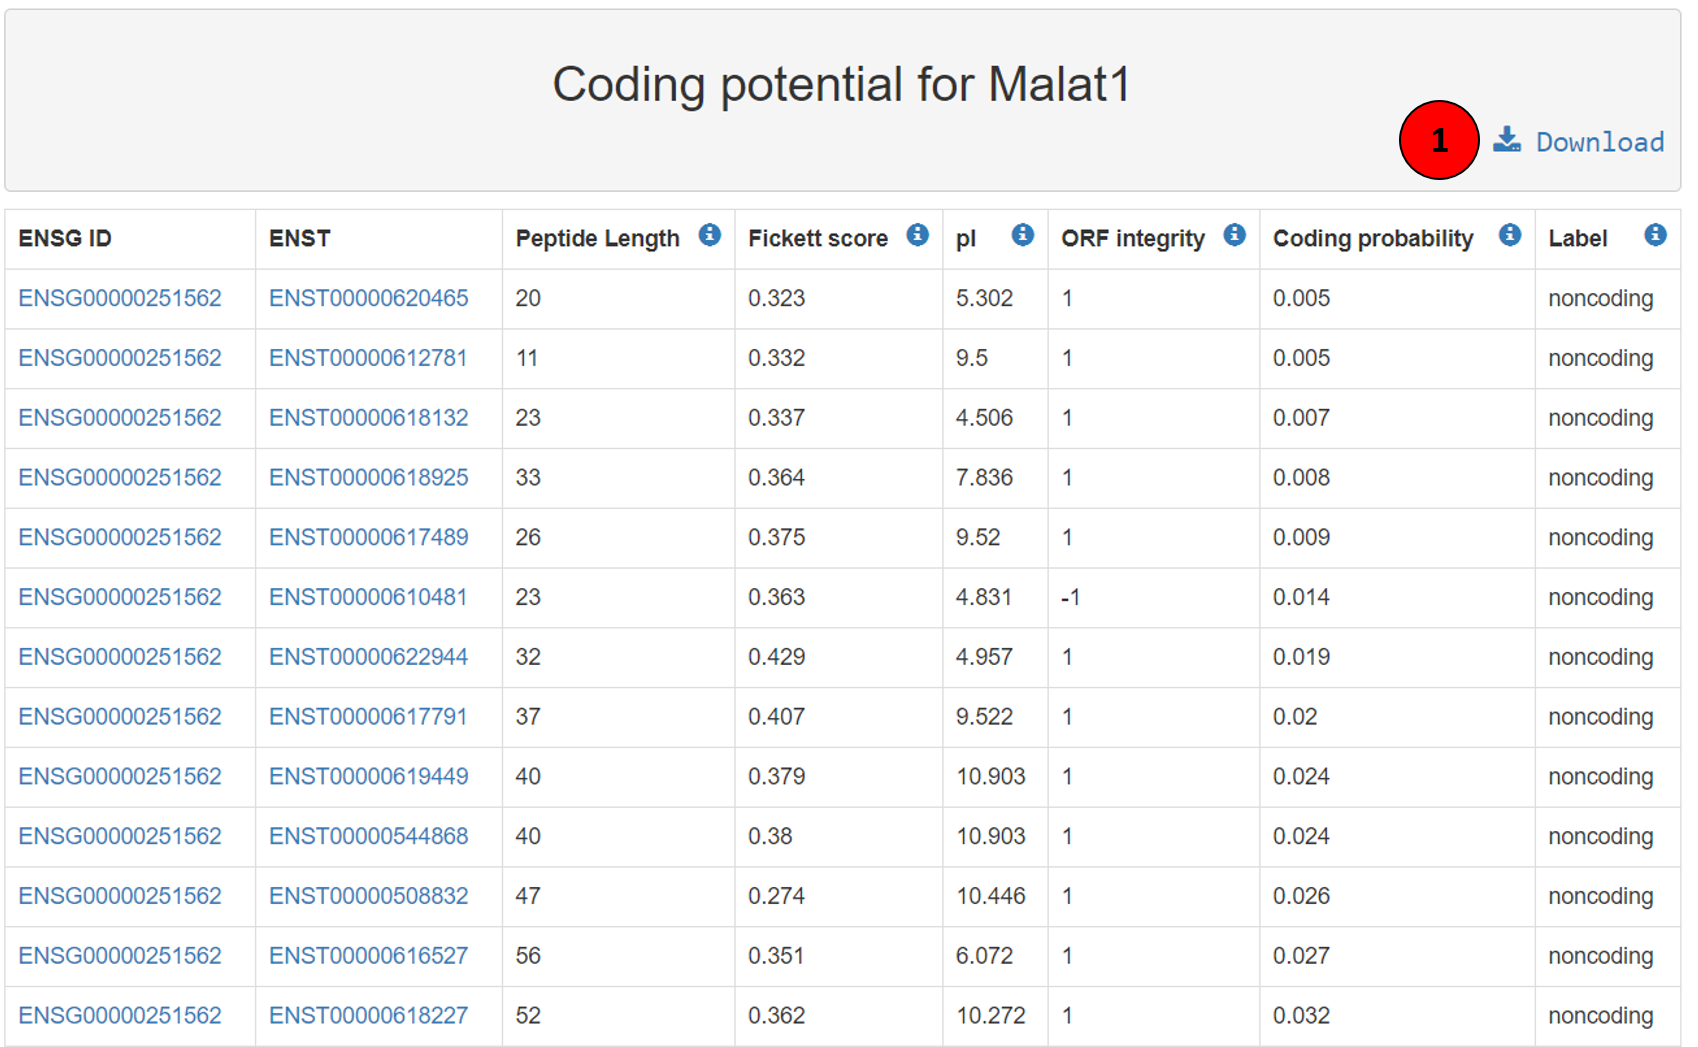
The coding potential of all the lncRNA transcripts is available on Lantern and can be visualized as in the screenshot. The first column contains the ENSG ID of the lncRNA, second column contains the ENST ID of the lncRNA transcript, both hyperlinked to ensembl. Third column is the peptide length or length of the open read frame, fourth column is the Fickett score (Fickett Score is used to evaluate each bases unequal content frequency and asymmetrical distribution in the positions of codons in one sequence) for the transcript, fifth column describes the iso electric point, followed by open read frame integrity which depicts if the ORF starts and stops with the appropriate codons and then the coding probability of that transcript and respective label. The whole table can be downloaded using the download button (tagged as 1 in the screenshot).
G. LncRNA – SNP annotations:
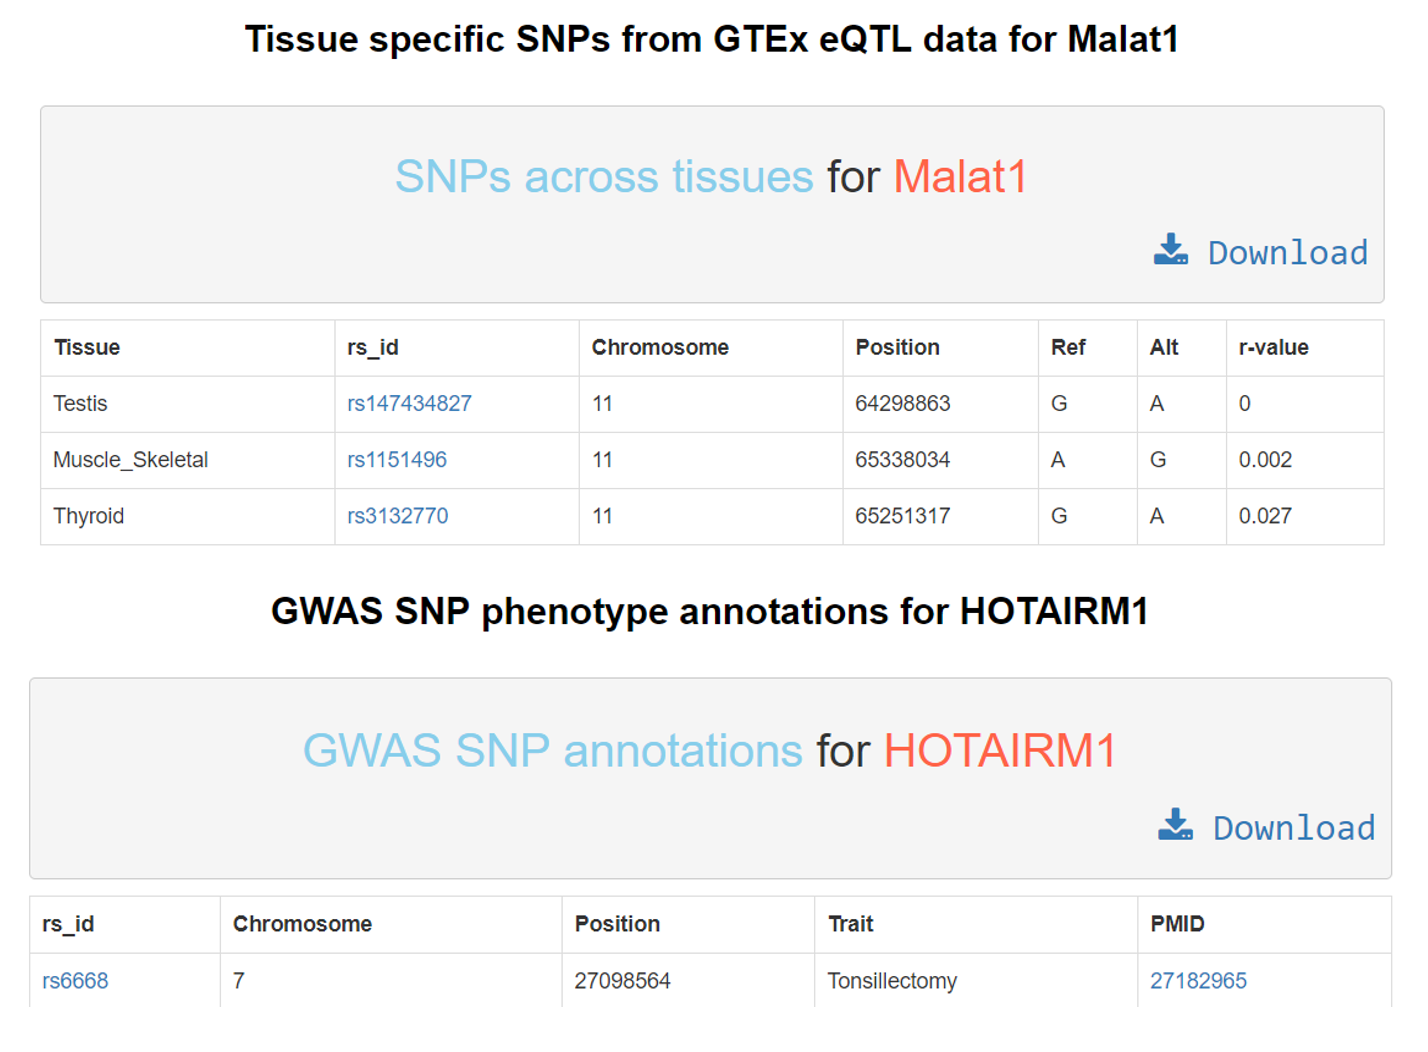
Various GTEx eQTL and GWAS SNPs occurring on the lncRNA locus can be obtained from Lantern as seen in the screenshot. The GTEx eQTL SNP table consists of the following columns: tissue in which the SNP was recorded, the SNP’s rsid hyperlinked to dbSNP. Followed by genomic coordinates of the SNP. Fifth and sixth column indicating reference and alternative nucleotides and finally the GTEx reported r-value for the SNP. The GWAS SNP table has the phenotype associations annotated to the rsid from dbSNP, genomic coordinates and the respective PMID of the article validating that association, hyperlinked to PubMed. Both tables can be downloaded using the download button.
H. Browse by ontology annotations:
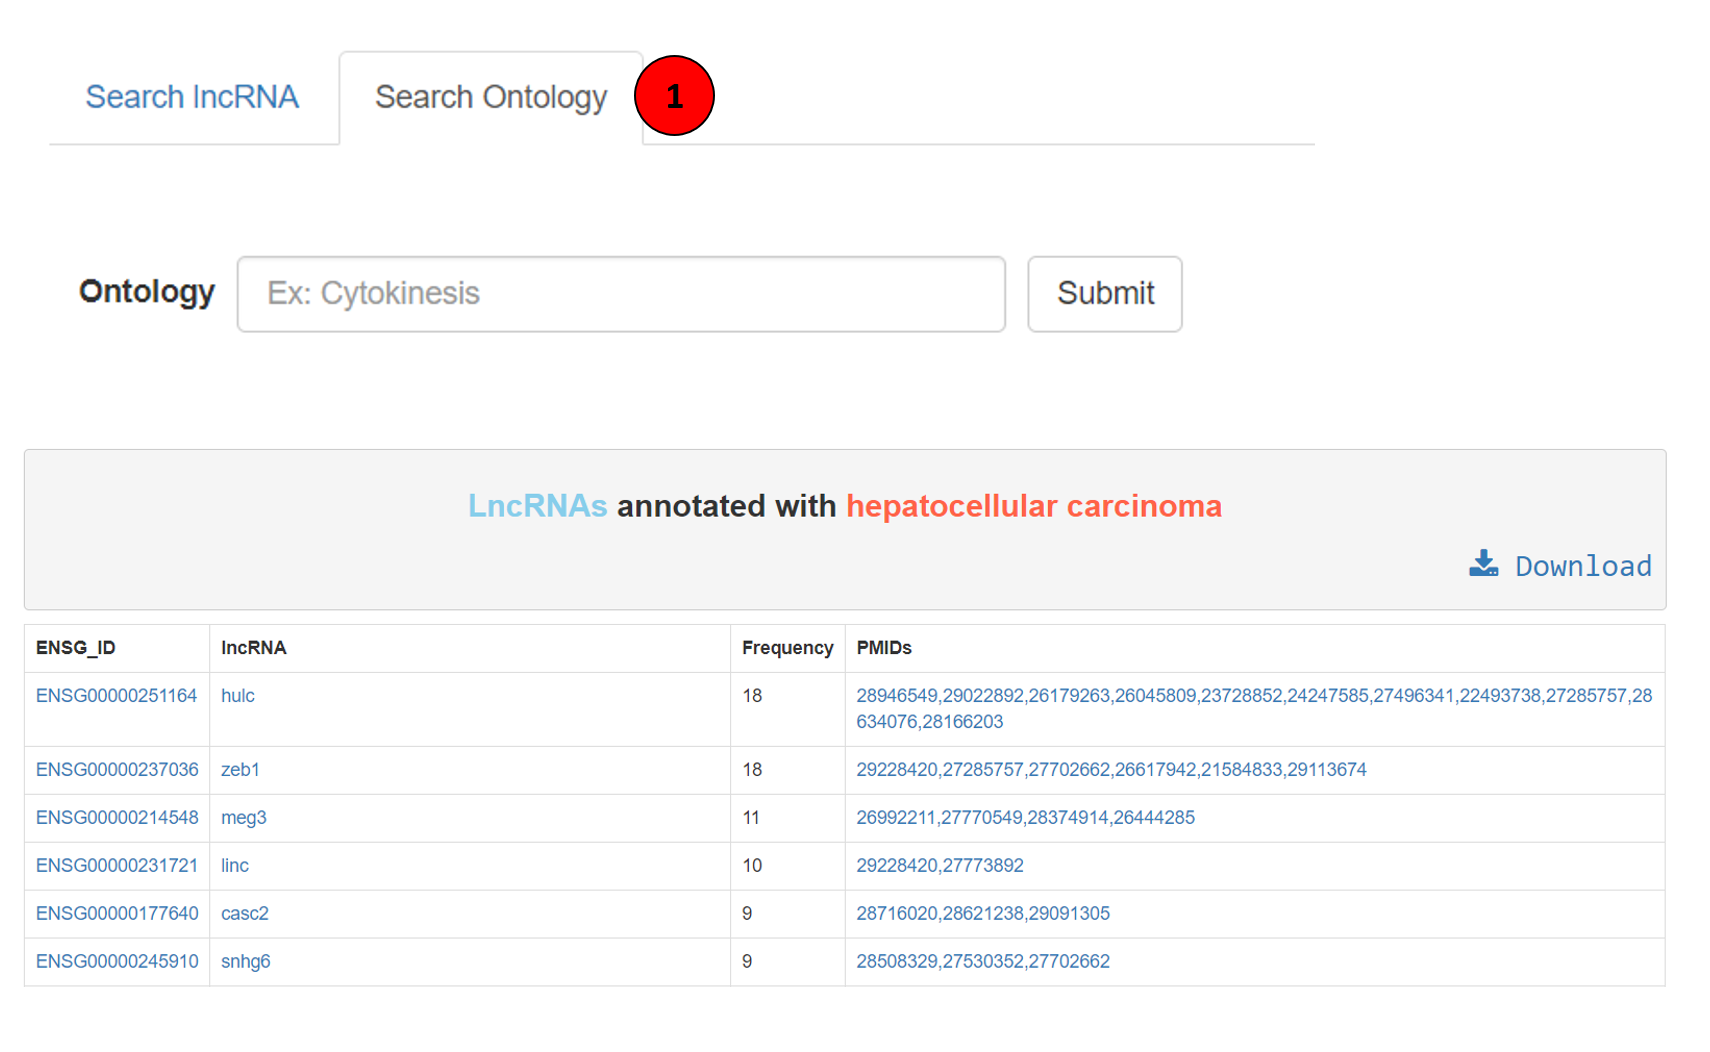
This component of Lantern enables users to search lncRNAs associated to an ontology of interest. This can be done by clicking on the search ontology tab on the home page of lantern (marked as 1 in the screenshot). This search box is as well equipped with auto-suggestive feature. The resulting table can be seen as the table in the screenshot, the first column showing the ENSG ID of the lncRNA, followed by name of the lncRNA, frequency of occurrence of this association and the respective source article PMID (hyperlinked to PubMed). The whole table can be downloaded using the download button.
I. Download lncRNA annotations:
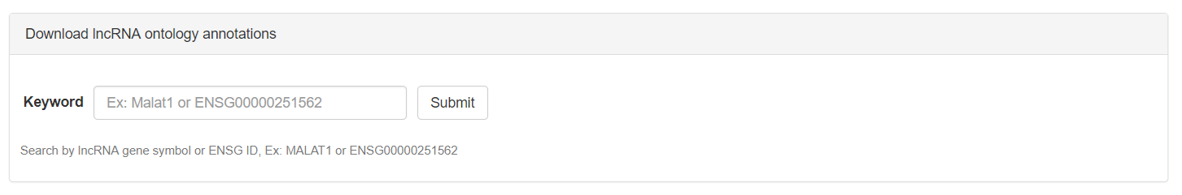
LncRNA annotations can also be downloaded in bulk by clicking the download link on the home page navigation bar. The download page will look like the above screenshot, lncRNA of interest can be searched from the auto-suggestion enabled search box.
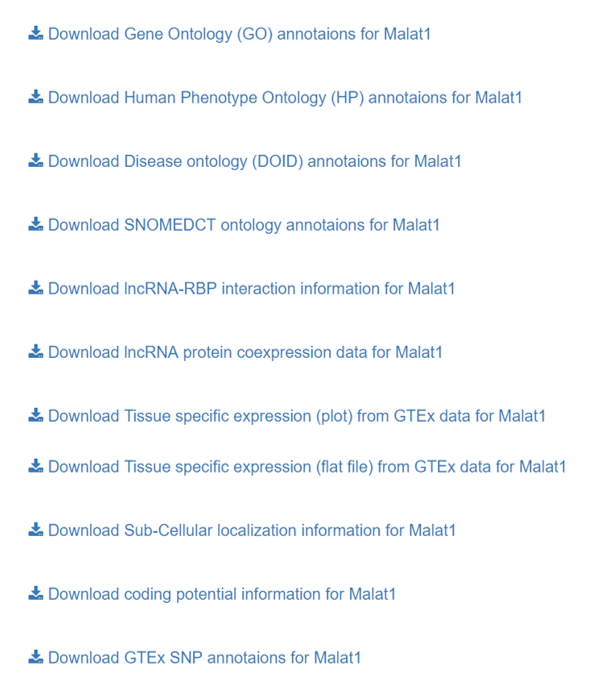
The resulting output page should look like the above screenshot showing links to download all the annotations of a lncRNA in one page.